
Fig. 8.
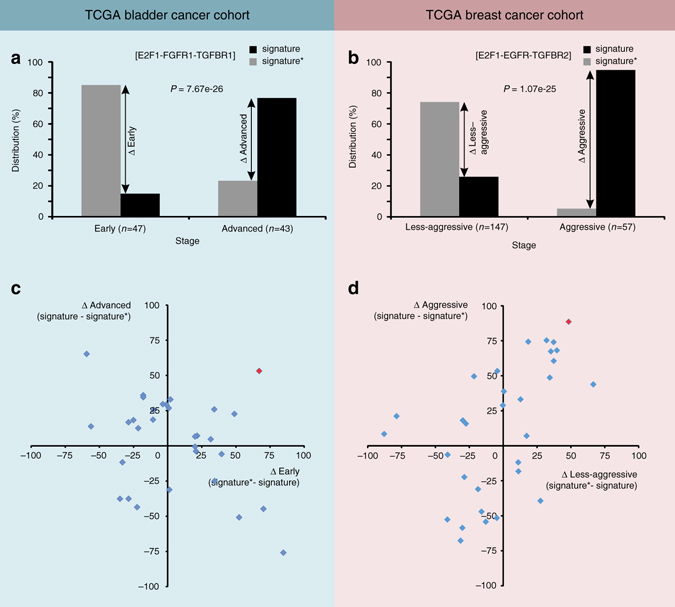
Validation of molecular signatures in a TCGA bladder and b TCGA breast cancer cohorts. In the bladder cancer cohort, we first filtered patients diagnosed with early (stage II) and advanced (stage IV) stages. Further in both stages, we identified subsets of patients where expression of genes of the molecular signature (i.e., E2F1, TGFBR1, and FGFR1) was above (signature) or below (signature*) the respective mean expression value. In case of the breast cancer cohort, we classified patients into aggressive (basal & Her2) vs. less-aggressive (luminal A and B) molecular subtypes based on PAM50 stages provided. Afterwards we identified those subsets of patients where expression of genes of the molecular signature (i.e., E2F1, TGFBR2, and EGFR) was above (signature) or below (signature*) the respective mean expression value. We calculated distribution difference (%) of patients within pathological stages in both cancer types. Similarly, distribution differences for 30 random signatures vs. signatures* derived from c bladder and d breast cancer regulatory cores are shown as scatter plots. Signatures in the upper right or lower left corners nicely distinguish patient phenotypes. The molecular signatures predicted from our workflow are shown in red. P-value is calculated using Pearson’s χ 2 test