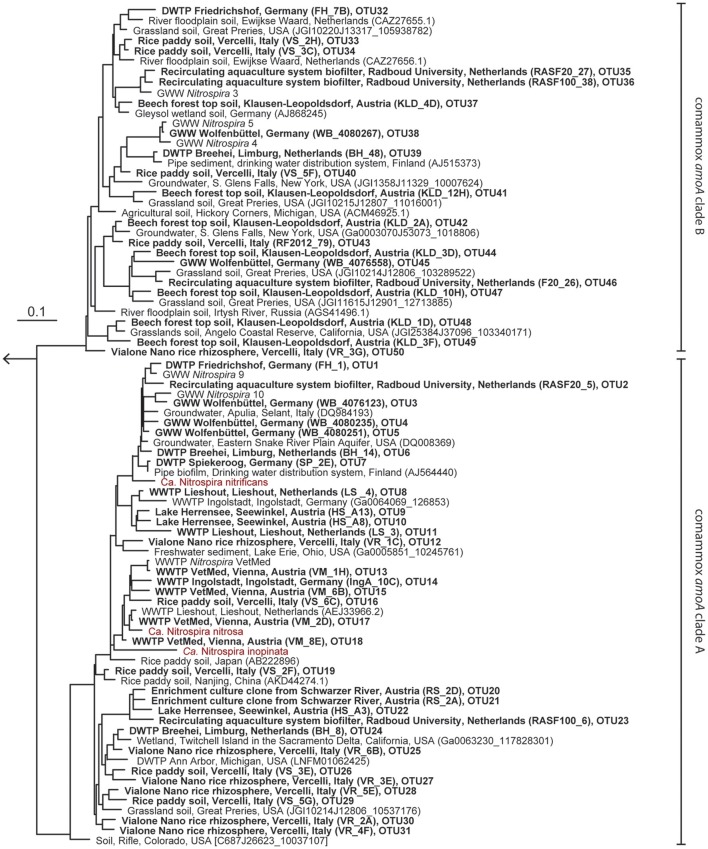
Figure 1.
Maximum likelihood tree showing the phylogenetic affiliation of comammox amoA genes obtained in this study (printed in boldface) to reference amoA sequences from comammox clades A and B. One representative sequence from each OTU is shown. Identifiers of clones (in parentheses) and of OTUs are indicated. Previously described comammox Nitrospira strains are shown in red. The outgroup consisted of selected betaproteobacterial amoA and proteobacterial pmoA genes. The scale bar indicates the estimated change rate per nucleotide.

