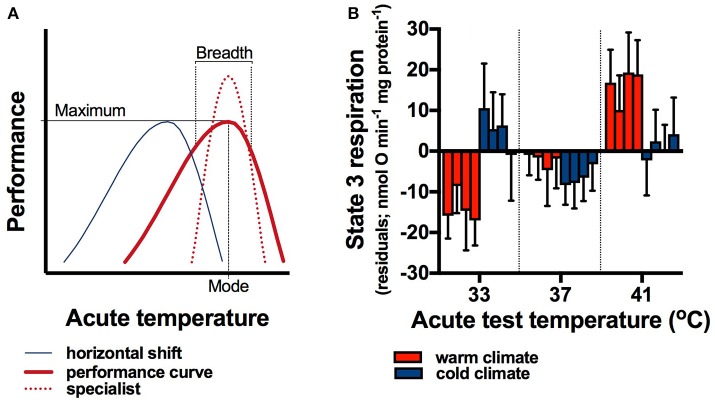
Figure 1.
Responses of animals to variable environments. Thermal performance curves (A; thick red line) have a maximum at the optimal temperature (mode), and decreasing performance at either side of the maximum. The performance breadth, typically defined as the temperature range over which performance is greater than 80–90%, can change in response to temperature variation, producing specialist phenotypes (broken red line) with a narrower performance breadth but greater maximum. Plastic responses to temperature variation as a result of developmental processes or reversible acclimation can shift the performance curve so that the mode coincides with a different mean temperature (blue line), which may be advantageous for endotherms that experience lower body temperatures in colder climates. Thermal performance curves of maximal mitochondrial respiration rates (state 3 rates) shifted between populations of bush rats (Rattus fuscipes) living in different climates (B). Rats from cold climate populations had significantly lower body temperatures than those from warm climate populations (Glanville et al., 2012). Concomitantly to body temperature differences, state 3 respiration rate was highest at low temperatures in cold climate rats, but it increased with increasing temperature in warm climate rats (climate*test temperature interaction), indicating that thermal performance curves shifted to compensate for the lower body temperatures in cold climates. Residuals are shown here, and within each group of four bars within acute test temperatures the first (left) bar shows data from vastus lateralis muscle, the second from heart ventricle, the third from liver, and the forth (right) bar shows data from brown adipose tissue. Means ± s.e.m. are shown, n = 10 rats from each population (averaged within climates), and data measured at different temperatures are separated by a thin dotted line to aid in visual clarity.

