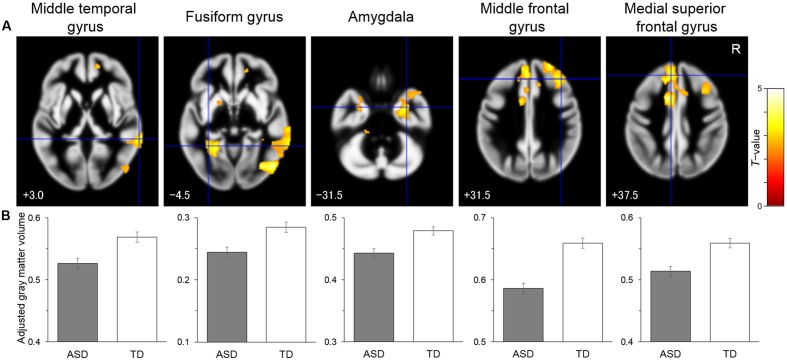
FIGURE 1.
Brain regions showing significantly reduced gray matter volume in the autism spectrum disorder (ASD) group relative to the typically developing (TD) group. (A) Statistical parametric maps. The areas are overlaid on the template gray matter image. Numbers below the slices indicate the z-axis of the Montreal Neurological Institute system coordinates. The blue crosses indicate the activation foci and the red–yellow color scale represents the T-value. R, right hemisphere. (B) Mean (with SE) adjusted gray matter volume at the peak voxel. Effects of no interest (sex and age) were cavaried out.

