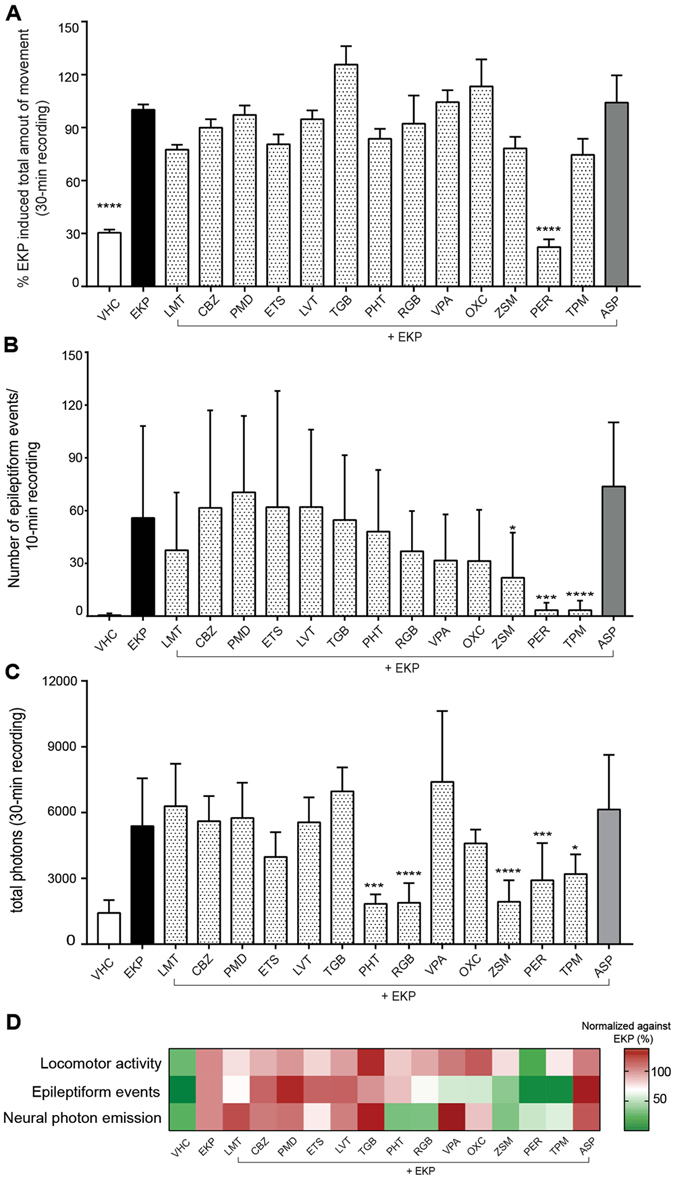
Figure 5.

Quantitative analysis and comparison of locomotor activity, electrographic activity and neuroluminescence of larvae treated with EKP in combination with/without ASDs. (A) Larval locomotor activity within a 30-min recording normalized to EKP control (set at 100%). Results are shown as mean ± s.e.m. of 12 experiments (recordings of individual larvae) performed in triplicate. (B) Number of epileptic events within a 10-min recording (mean ± s.d.). Number of recordings analyzed were: VHC (n = 35), EKP (n = 58), LMT (n = 13), CBZ (n = 11), PMD (n = 14), ETS (n = 18), LVT (n = 14), TGB (n = 13), PHT (n = 14), RGB (n = 16), VPA (n = 14), OXC (n = 13), ZSM (n = 15), PER (n = 14), TPM (n = 16) and ASP (n = 12). (C) Number of photons emitted within a 30-min recording. Results are expressed as mean ± s.d. of at least 5 independent experiments. For each experiment a group of three larvae was used. All results (A, B, C) were analyzed using one-way ANOVA. Significant differences compared to EKP group are marked with *, **, ***, **** (p ≤ 0.05, p ≤ 0.01, p ≤ 0.001 and p ≤ 0.0001 respectively). (D) Heat map comparison of larval responses against EKP after different ASD treatment as examined by locomotor tracking, electrographic activity recording and neuroluminescence measurements. Data from ASD-treated larvae were normalized against results of the EKP-treated groups.
