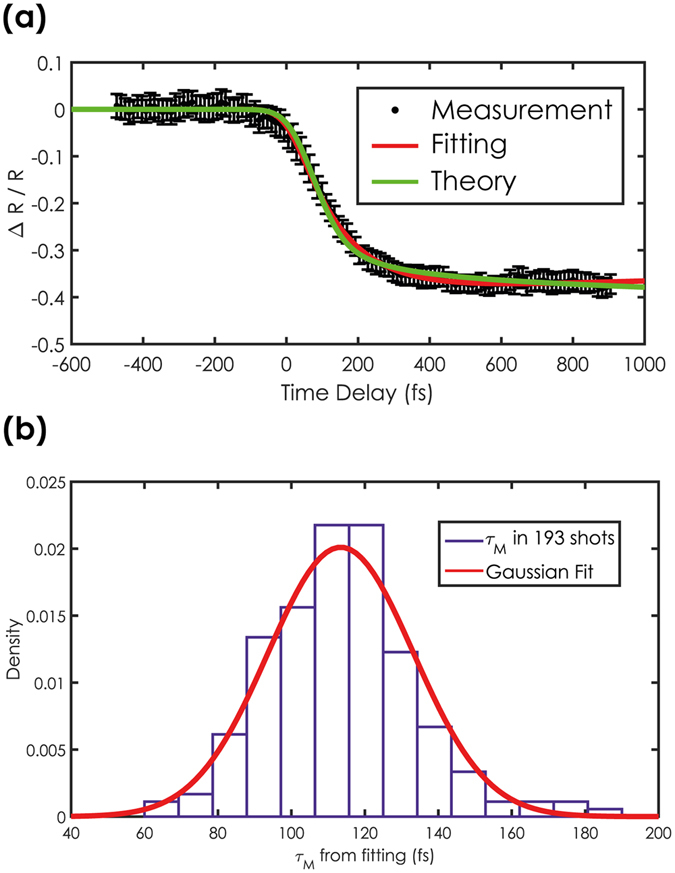
Figure 3.

(a) Time resolved reflectivity curve extracted from the single-shot transient reflectivity image in Fig. 2(d). The red line represents a fit with a double exponential decay while the green line is obtained by calculations on the basis of super-diffusive transport theory. Error bars are the standard deviation calculated throughout the rows of the TR-image. (b) Statistical distribution of the demagnetisation times as extracted from the fitting of 193 single-shot measurements of the ultrafast demagnetisation process.
