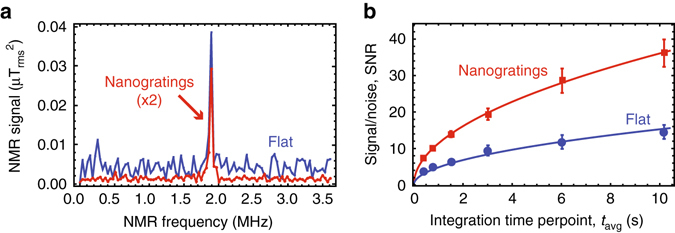
Fig. 4.

NV NMR sensitivity characterization. a 19F NMR signal from Fomblin® oil at B0 = 47.1 mT for flat and nanograting sensors implanted at 20 keV using XY8-13 correlation sequence. b NMR signal-to-noise ratio as a function of averaging time. Fits to the function SNR = give good agreement for both sensors (solid lines). The coefficient α was 2.4 times larger for the nanograting chip. Error bars represent standard error of the mean
