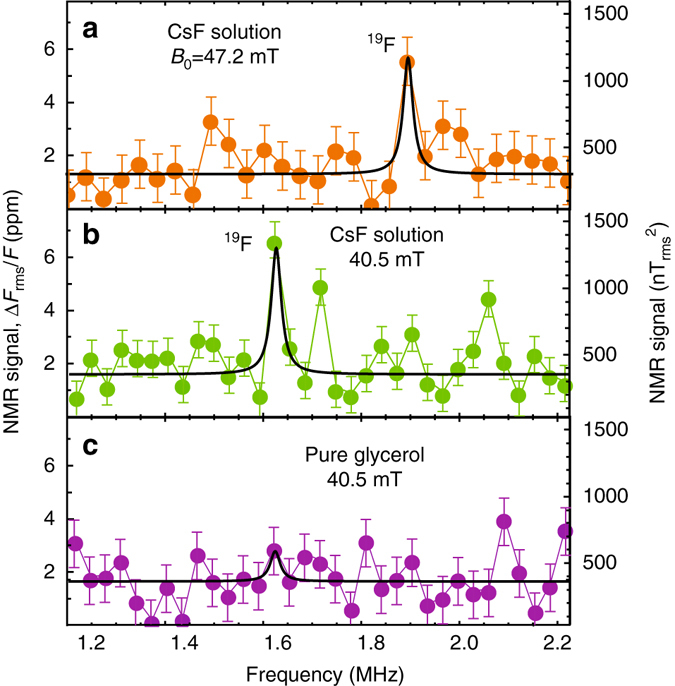
Fig. 5.

Solution NMR. a, b NMR spectra of 20% by weight CsF solution in glycerol at 47.2 and 40.5 mT. c NMR spectrum of pure glycerol. All spectra were measured with an XY8-10 correlation spectroscopy pulse sequence tuned to the 19F precession frequency. Each spectrum was fit to a single Lorentzian function with central frequency set to the anticipated 19F Larmor frequency. The linewidth was fixed to that of the 1H linewidth in glycerol obtained under similar conditions. The only free fit parameters were peak amplitude and offset. We assume that each spectrum contains at most one NMR line (from 19F) and other fluctuations are due to noise. Error bars represent standard deviation of off-resonant points
