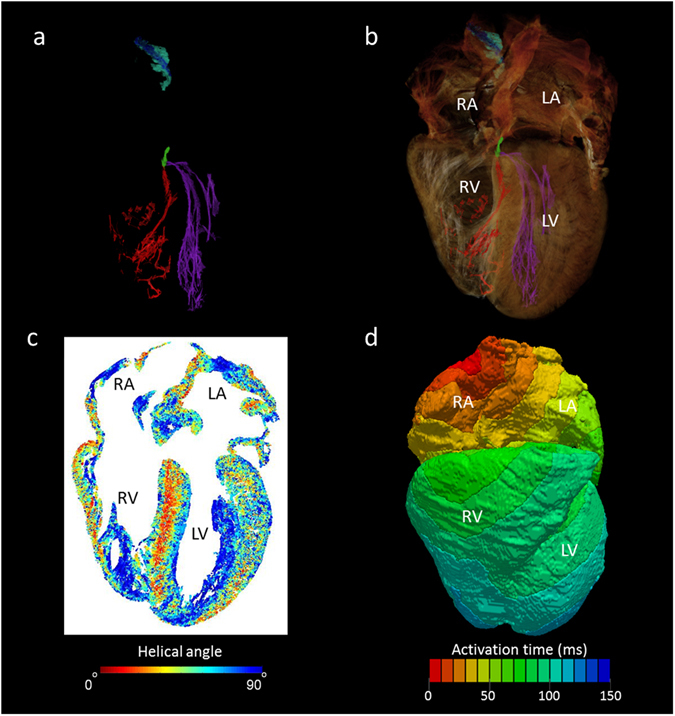
Figure 7.

The utility of whole heart micro-CT data in mathematical modelling of cardiac depolarisation. Panel (a) shows the conducting tissue segmented from human whole heart micro-CT dataset; sinus node (blue), paranodal area (turquoise), atrioventricular conduction axis (green), the right (red) and left (purple) Purkinje networks. Panel (b) places the segmented conduction system in the anatomical context of the surrounding myocardium. Panel (c) shows a four-chamber view of cardiomyocyte orientation in which the absolute helical angles derived from the CT dataset are coded in colour (see colour map). Panel (d) is an illustrative isochrone map of cardiac depolarisation seeded from the sinus node. The model incorporates the anatomically accurate geometry of the myocardium and the accurate disposition of the conduction system with the electrical properties of these various regions derived from published electrophysiological measurements. IAS- interatrial septum, IVS- interventricular septum, LA- left atrium, LV- left ventricle, RA- right atrium, RV- right ventricle.
