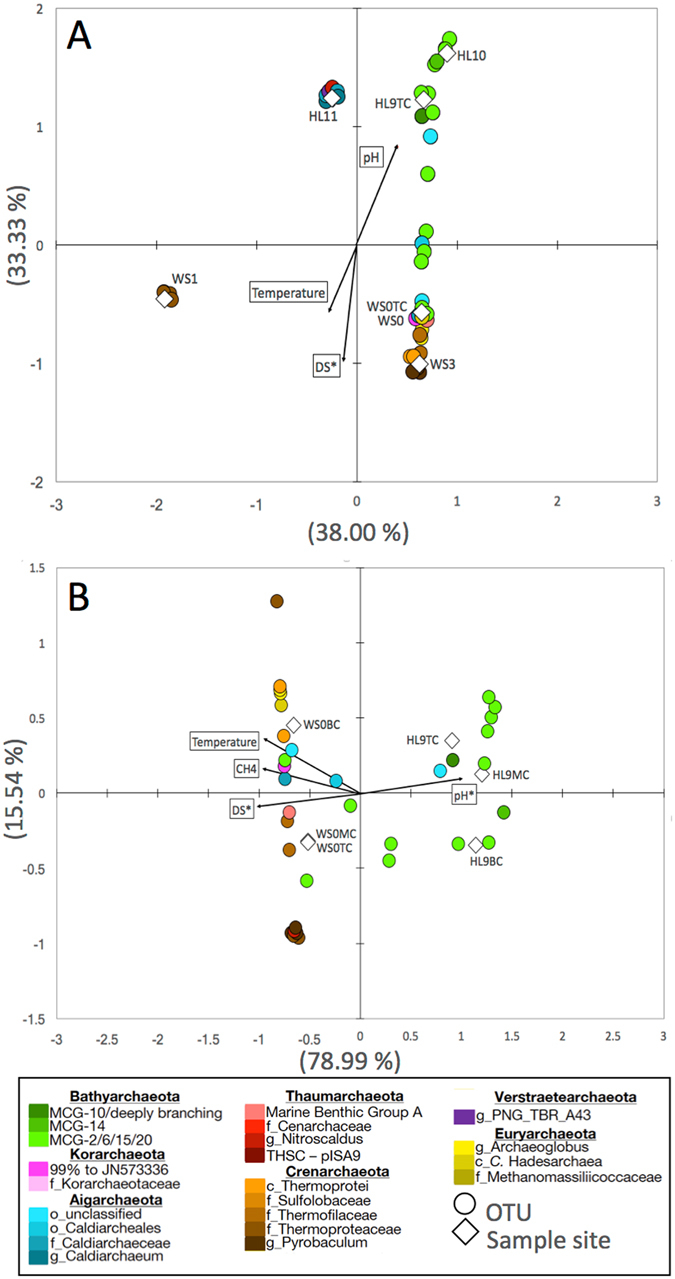
Figure 3.

Canonical Correspondence Analyses of phylogenetic distribution and major geochemical parameters. Surface samples are compared to temperature, pH, dissolved sulfide (DS) and plotted with OTU distribution (A). Top, middle, and bottom sediment layers from core samples are compared to temperature, pH, DS, and porewater CH4 concentrations and plotted with OTU distribution (B). OTUs representing >0.5% sequence abundance are indicated by circles. Colors correspond to those in Fig. 1. White diamonds indicate sample sites. Black arrows indicate physicochemical parameters.
