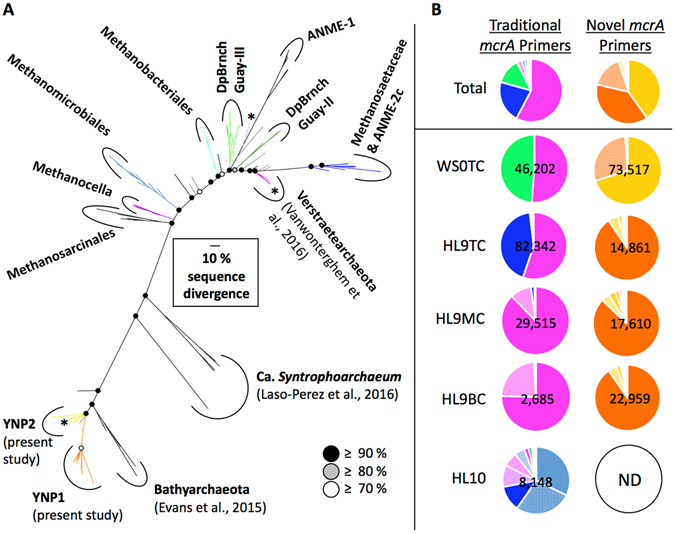
Figure 4.

Phylogeny and occurrence of Bathyarchaeota-like (orange and yellow), verstraetearchaeotal (pink), and euryarchaeotal (other colors) McrA proteins. (A) Bayesian analysis of McrA phylogeny based on 150 amino acid positions. Heavy weighted branches indicate sequences recovered in the present study. Asterisks denote mcrA OTUs that were also recovered as RNA transcripts. Posterior probabilities are indicated by black, grey, or white circles at each node corresponding to ≥90%, ≥80%, and ≥70%, respectively. (B) Site specific relative abundance of mcrA OTUs produced by traditional and newly designed primer sets. Following the sample IDs, the designations “TC”, “MC”, and “BC” stand for “top core”, “middle core”, and “bottom core”, respectively. Total sequence number for each sample is given for each pie chart. No mcrA genes were amplified from HL10 with newly designed primers (ND = not determined). DpBrnchGuay = deeply-branching Guaymas group. The scale bar corresponds to 0.1 amino acid substitutions per site.
