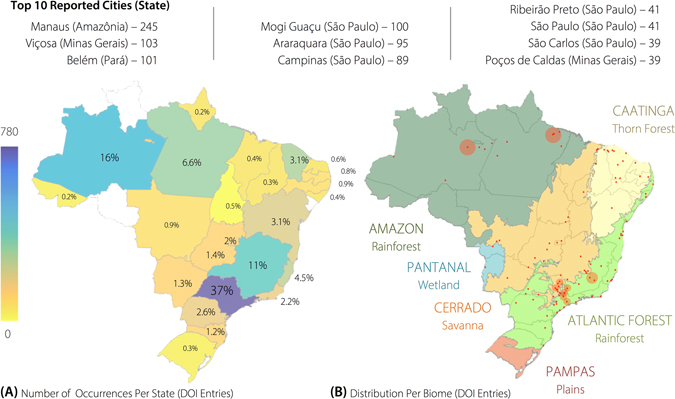
Figure 3.

Representation of the distribution of NuBBEDB compounds in Brazilian territory and its biomes. (A) Distribution of the species from which compounds in the NuBBEDB were identified for each Brazilian State. (B) Species from which the compounds in the NuBBEDB were identified are from all six different Brazilian biomes (the red dots represent the cities where these species were collected). The ten most frequently reported cities (upper part) are denoted in (B) as a red shadow (the size corresponds to the number of occurrences). Software used to create the map: Matlab R2016b (Mathworks, MA, USA).
