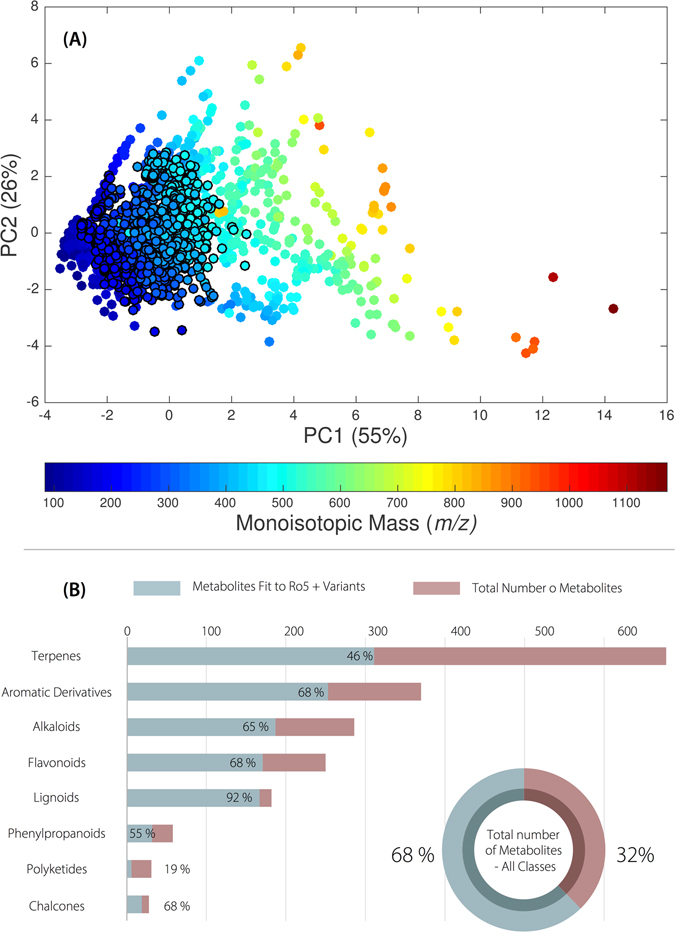
Figure 7.

(A) Principal component analysis applied to molecular descriptors (physicochemical properties) of the compounds present in the NuBBEDB. The gradient of colors represents the compound distribution as a function of the monoisotopic mass variable. Black borderlines were added to denote compounds obeying the Lipinski-Veber rules. (B) Pie chart representing the total number of compounds (from all metabolic classes) that obey the Ro5 and Variant rules and bar graphs representing the compound distributions for different metabolic classes are shown.
