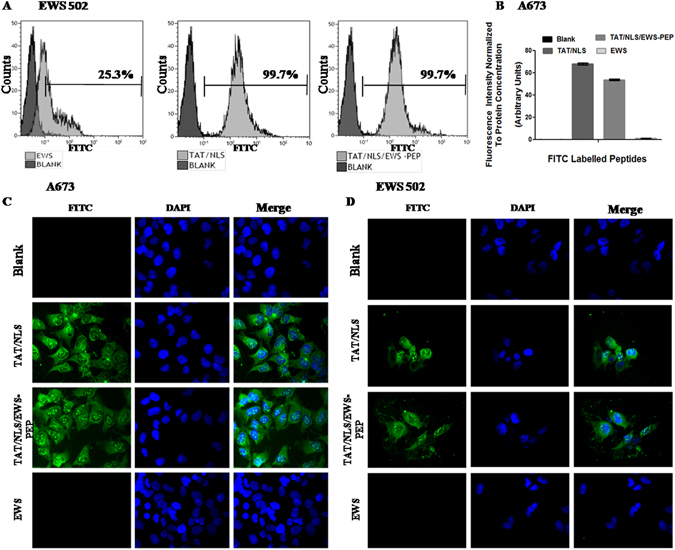
Figure 1.

Uptake and localization of peptides in Ewing’s sarcoma cells. (A) FACS analysis of EWS502 cells treated with (grey) or without (black) FITC labelled peptides. Percentage above the gate represents FITC positive population. (B) FITC Fluorescence intensity of A673 cell lysates, either untreated or treated with FITC labelled peptides. (C) Fluorescence images of A673 cells either untreated or treated with FITC labelled peptides, captured at 40× magnification. (D) Fluorescence images of EWS 502 cells, untreated or treated with FITC labelled peptides.
