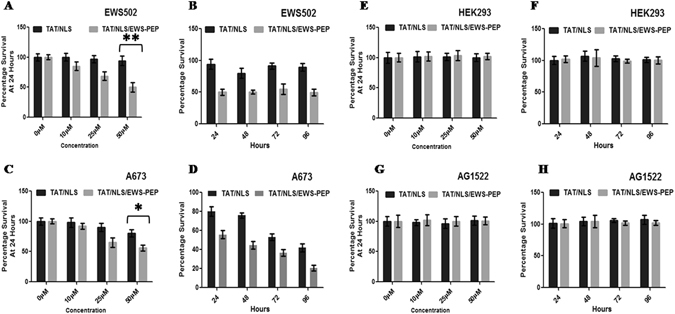
Figure 3.

Cell proliferation analysis. Percentage survival of EWS502 in response to different concentrations of peptides (A) and for various time intervals (B). Percentage survival of A673 cells in response to different concentrations of peptides (C) and for various time intervals (D). Percentage survival of HEK293 cells in response to different concentrations of peptides (E) and for different time intervals. (F) Percentage survival of AG1522 cells in response to different concentrations of peptides (G) and for different time intervals (H). *p < 0.05, **p < 0.01.
