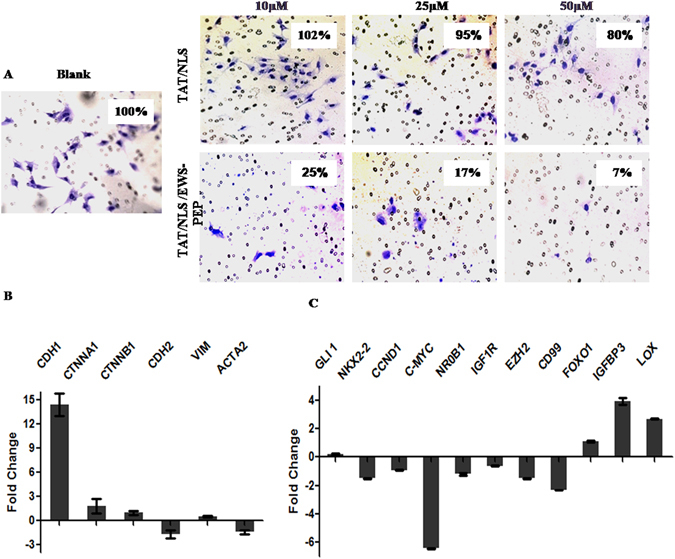
Figure 6.

Effects of peptide on invasion and gene expression in A673 Ewing’s sarcoma cells. (A) Representative photographs of crystal violet stained A673 cells (either untreated or peptide treated) which invaded the matrigel layer, captured at 40× magnification. (B) Fold change in EMT marker genes (CDH1 – E-cadherin, CTNNA1- α catenin, CTNNB1-β catenin, CDH2 – N cadherin, VIM – vimentin, ACTA2 – α smooth muscle actin) expression levels in response to TAT/NLS/EWS-PEP treatment at 50 µM concentration. Ct values from TAT/NLS treated cells were used as reference to calculate fold change in expression and GAPDH gene expression was used for normalization. (C) Fold change in EWS-FLI1 target genes (GLI1 – Glioma associated oncoprotein 1, NKX2-2 – NK2 homeobox 2, CCND1-cyclin D, c-MYC, NR0B1- Nuclear Receptor subfamily 0 Group B member 1, IGF1R – Insulin like growth factor receptor 1, EZH2 – Enhancer of zeste 2 polycomb repressive complex2 subunit, FOXO1 - Fork head box protein O1, IGFBP3 – Insulin like Growth Factor Binding Protein 3 and LOX – Lysyl Oxidase expression levels in response to TAT/NLS/EWS-PEP treatment at 50 µM concentration. Ct values from TAT/NLS treated cells were used as reference to calculate fold change in expression and GAPDH gene expression was used for normalization.
