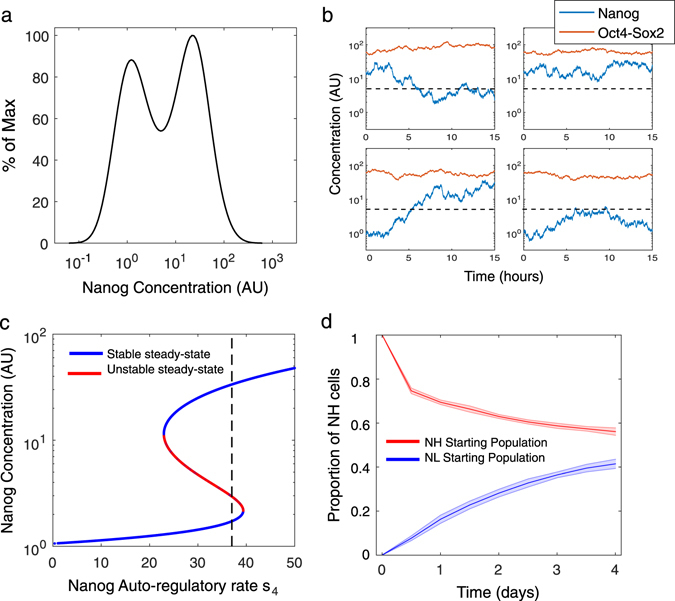
Fig. 2.

System dynamics and stability in serum/LIF (PD = Chiron = 0 AU) a Steady-state distribution of Nanog simulated in 1000 cells showing that approximately 50% of the cells are in Nanog High (NH) and 50% Nanog Low (NL) states. b Four representative time-course simulations of Nanog (blue line) and Oct4-Sox2 (red line) in single cells over 15 h. Oct4-Sox2 dimer concentration remains fairly constant compared to Nanog. The horizontal black dotted line represents the threshold between NH and NL. c Continuation of Nanog steady-state for the deterministic system (no noise). Blue lines are stable steady-states, while the red line is unstable. The maximal transcription rate, s 4 (dotted black line), intersects both NH and NL steady-states, indicating bistability. d Sorting simulation: the dynamics of NH or NL cells (1000 for each state) are simulated over 4 days, and the proportion of cells in the NH state is recorded every 12 h (n = 10, shaded areas indicate standard deviation). The simulations show the cells tending towards the steady-state distribution of approximately 50% NH and 50% NL
