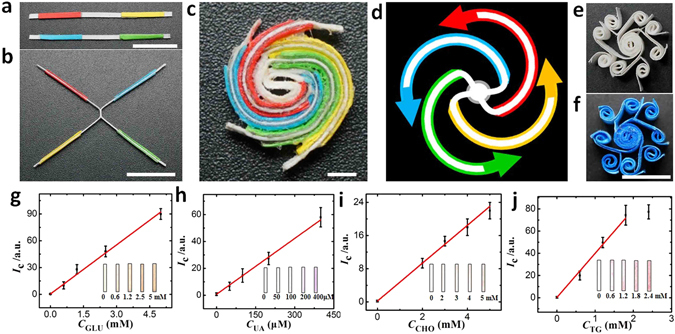
Figure 4.

(a,b) Photographs of the paper strips attached with tapes for the device fabrication. (c) The resulted 2D vPAD for colorimetric detection of four analytes (GLU: glucose, UA: uric acid, CHO: cholesterol, TG: triglycerides), scale bar: 2 mm. The colors of the paper strips are from the double-sided adhesive tapes used to assemble the device. (d) The resulted fluidic channels and flow direction (indicated by arrows) of aqueous sample in the device. (e) The vPAD for carrying out eight parallel assays. (f) The vPAD after introduction of 0.010 M coomassie brilliant blue solution. The assays results measured from the 2D vPAD for colorimetric detection of four analytes: (g) GLU: glucose; (h) UA: uric acid; (i) CHO: cholesterol; and (j) TG: triglycerides. The arrow bars indicate the standard deviation of three replicated measurements.
