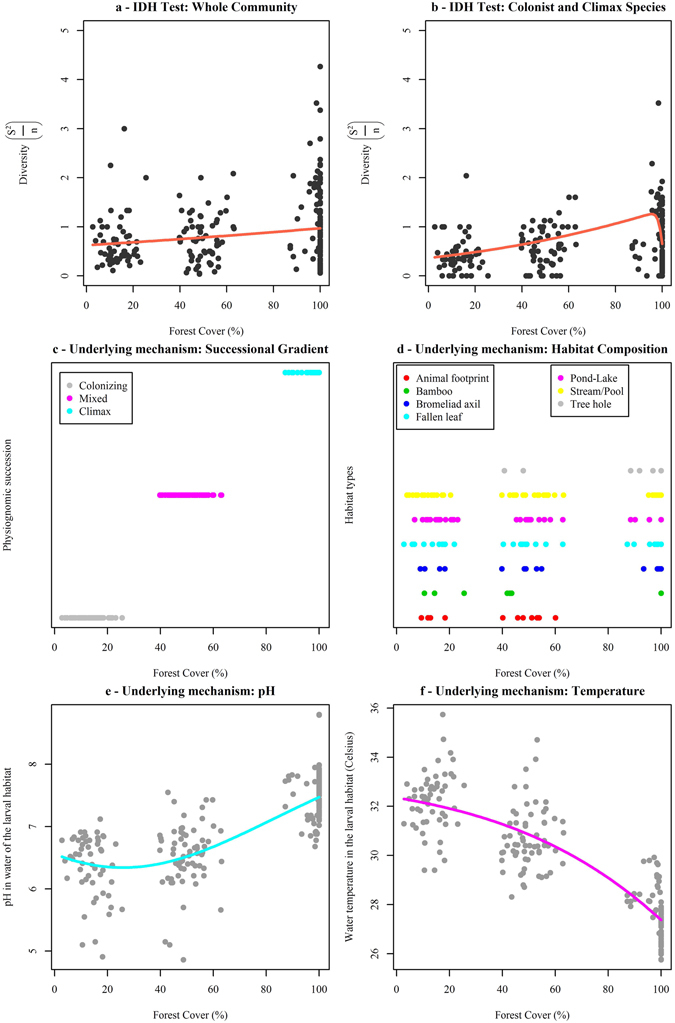
Figure 2.

IDH testing. (a) whole community. The best-fitting curve was more plausible than the null model (ΔAICc = 1.88; bootstrap likelihood ratio = 4:1) and meant that mosquito diversity increased as forest cover increased and vice-versa. (b) colonist and climax species (Connell’s fractions.). The best-fitting curve was slightly more plausible than the null model (ΔAICc = 0.37; bootstrap likelihood ratio = 2.3:1). Underlying mechanisms: 1) habitat complexity, (c) successional gradient and (d) habitat composition; and 2) larval habitat constraints, (e) pH. The best-fitting curve was more plausible than the null model (ΔAICc = 53.2) and (f) temperature. The best-fitting curve was more plausible than the null model (ΔAICc = 1,006). R program-scripts and full results of multi-model selection are available upon request.
