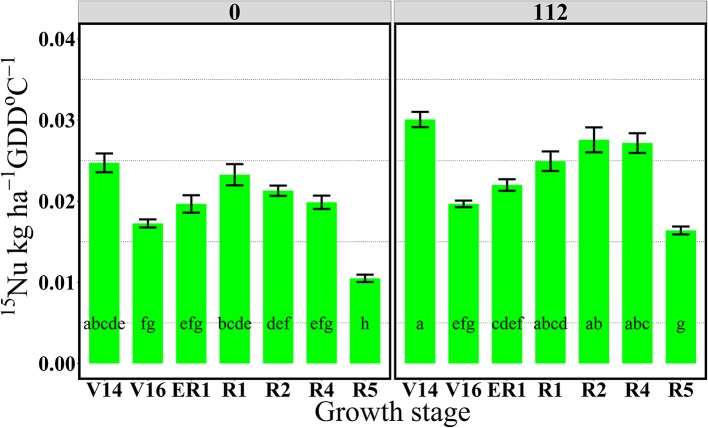
Figure 5.
Effects of growth stages on total 15N uptake rate per GDD (15Nu, kg ha−1 GDD °C−1) at two N rates 0 and 112 kg N ha−1. Values are the means of two locations (ACRE13 and PPAC) in 2013. Total 15N applied per growth stage was equal to 3.2 kg 15N ha−1. Error bars represent the standard error of the means. Letters represent significant differences between growth stages at the 0.05 level (Tukey HSD).

