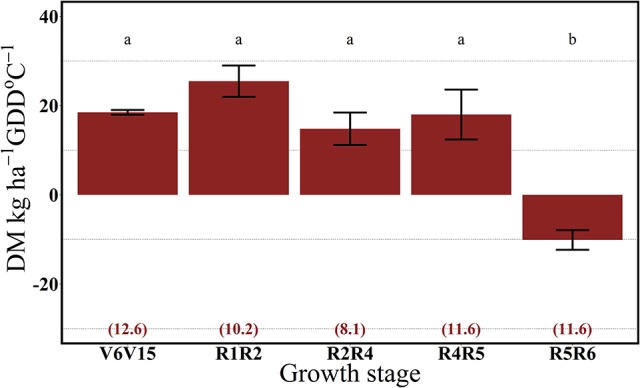
Figure 8.

Effects of growth stage intervals on total DM accumulation per GDD (DM, kg ha−1 GDD °C−1) average of two N rates (0 and 112 kg N ha−1). Numbers in parentheses are the daily cumulative GDD per growth interval (GDD °C day−1). Values are the means of one location (ACRE) in 2014. Error bars represent the standard error of the means. Letters represent significant differences between growth stage intervals at the 0.05 level (Tukey HSD).
