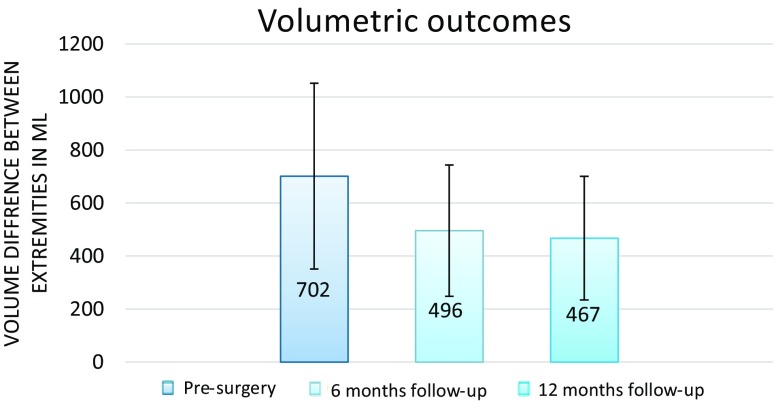
Fig. 2.
Average volume differences between the healthy and affected extremity at different time points during follow-up. Error bars indicate standard deviation (SD). Significance was reached between baseline and 6 months of follow-up (p < 0.001), between baseline and 12 months of follow-up (p < 0.001), and between 6 months of follow-up and 12 months of follow-up (p < 0.02)

