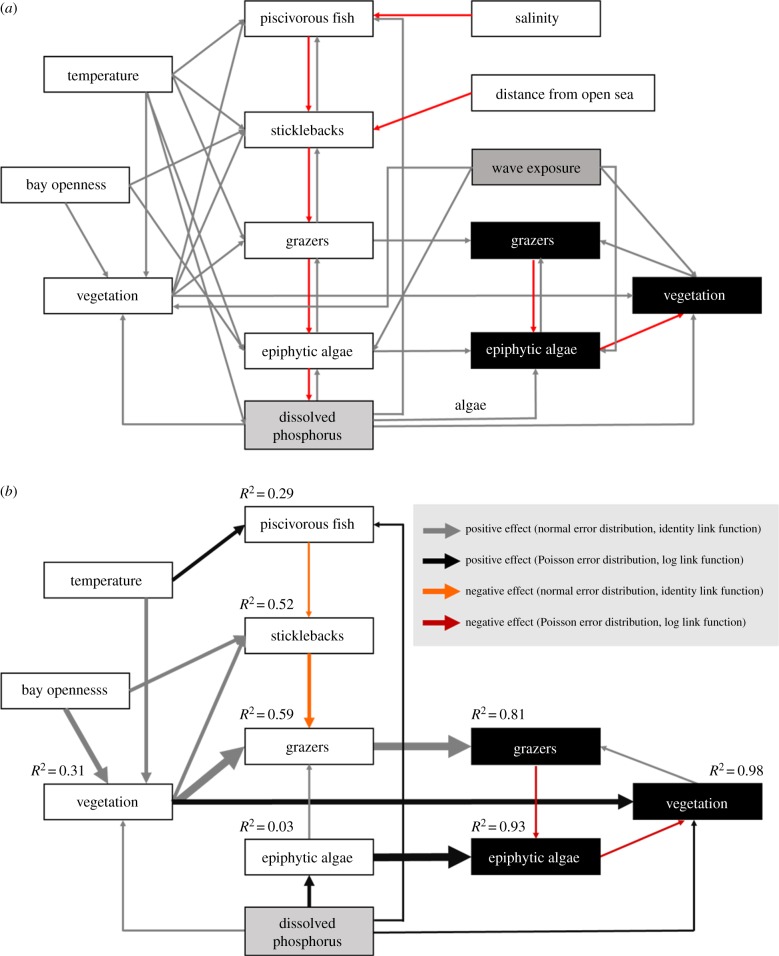
Figure 3.
(a) Schematic of all variables and paths included in the models. White, black and grey boxes indicate variables estimated at bay, station and both scales, respectively. Grey arrows represent positive effects, and red arrows are negative effects. (b) Best-supported structural equation models representing significant relationships between trophic levels and environmental factors at bay and station scale. Arrow widths are proportional to the standardized path coefficients. Marginal R2-values are shown for endogenous variables.

