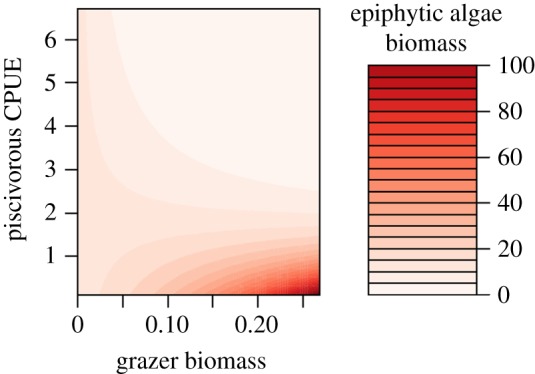
Figure 4.

Relationship between station-level epiphytic algae (% biomass of total above-ground vegetation) and grazer biomass (g AFDW), and piscivore biomass (CPUE, kg per net night). When piscivore biomass is greater than 2, epiphytic algae biomass decreases steeply with increasing grazer biomass (indicative of top-down control). When piscivorous biomass is less than 2, epiphytic algae and grazer biomass instead correlate positively (bottom-up control).
