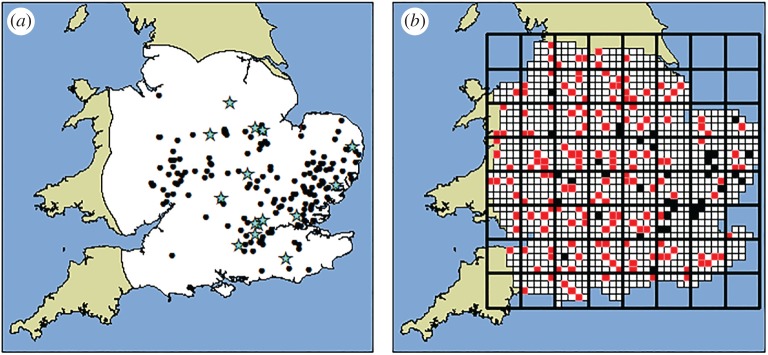
Figure 1.
Survey design stages. (a) All 191 AOD-positive locations known in 2014, the black dots represent self-reported cases and discoveries made during the preliminary 2013 survey are indicated by stars. The white area shows the buffer region used for survey design (the area of land adjacent to all positive sites, to a distance defined by the maximum nearest neighbour distance between all AOD detections). (b) Elements of the survey design. The large squares with thick black lines represent the 50 × 50 km squares. All hectads intersecting the buffer are shown in white, except those selected for survey which are appear filled: the 160 selected for survey shaded in red (grey in greyscale version) and the 38 selections that already contained AOD detections shaded in black. (Online version in colour.)

