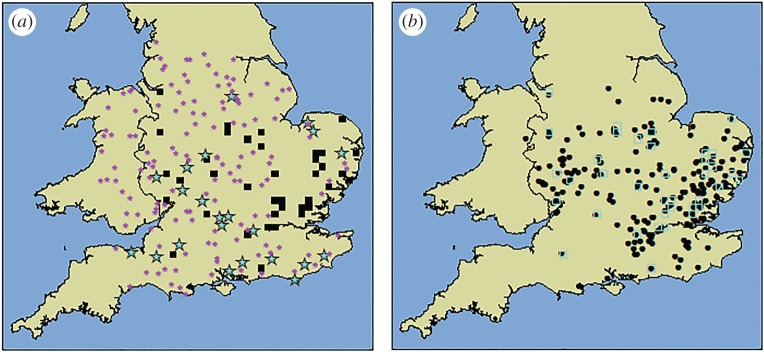
Figure 2.
Results from the 2014 survey. (a) The locations of all survey sites and selected hectads that already contained AOD reports (black squares). Sites where AOD was detected are shown as turquoise stars and those without symptoms are shown using purple asterisks (grey in greyscale version). (b) All self-reported cases used in the final analysis (black dots). The locations of selected squares that were not surveyed are again shown outlined in turquoise (grey in greyscale version). (Online version in colour.)

