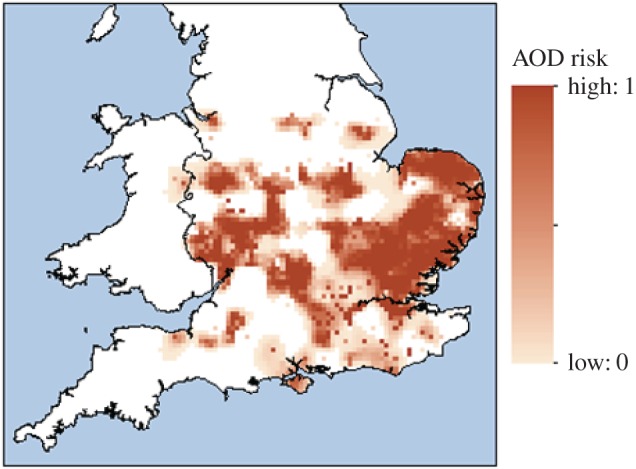
Figure 3.

Final prediction of area at risk from AOD. Dark brown areas have a probability of infection of 1 and white areas 0; all shades in between represent intermediate probabilities of infection (with a linear relationship from maximum to minimum; see legend for scale). (Online version in colour.)
