
Figure 2.
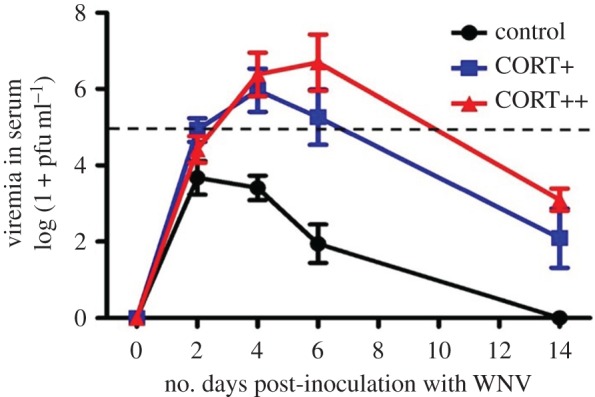
Viremia of zebra finches exposed to WNV across different experimental CORT treatments. CORT treatment ( , p < 0.0001), time (
 , p < 0.0001) and the interaction between treatment and time (
 , p < 0.0001) predicted host viremia. At peak viremia levels, hosts in the CORT+ and CORT++ treatments (square and triangle symbols, respectively) had viral infection intensities that were approximately 2 orders of magnitude greater than those of control birds (circle symbols). The horizontal dashed line at 105 pfu WNV ml−1 indicates the proposed threshold for transmission of WNV from bird to mosquito; only birds in the elevated CORT treatments attained viremia levels above this transmission threshold. Points represent averages at sampled time points over the study. Error bars are ±1 s.e. of the mean. (Online version in colour.)