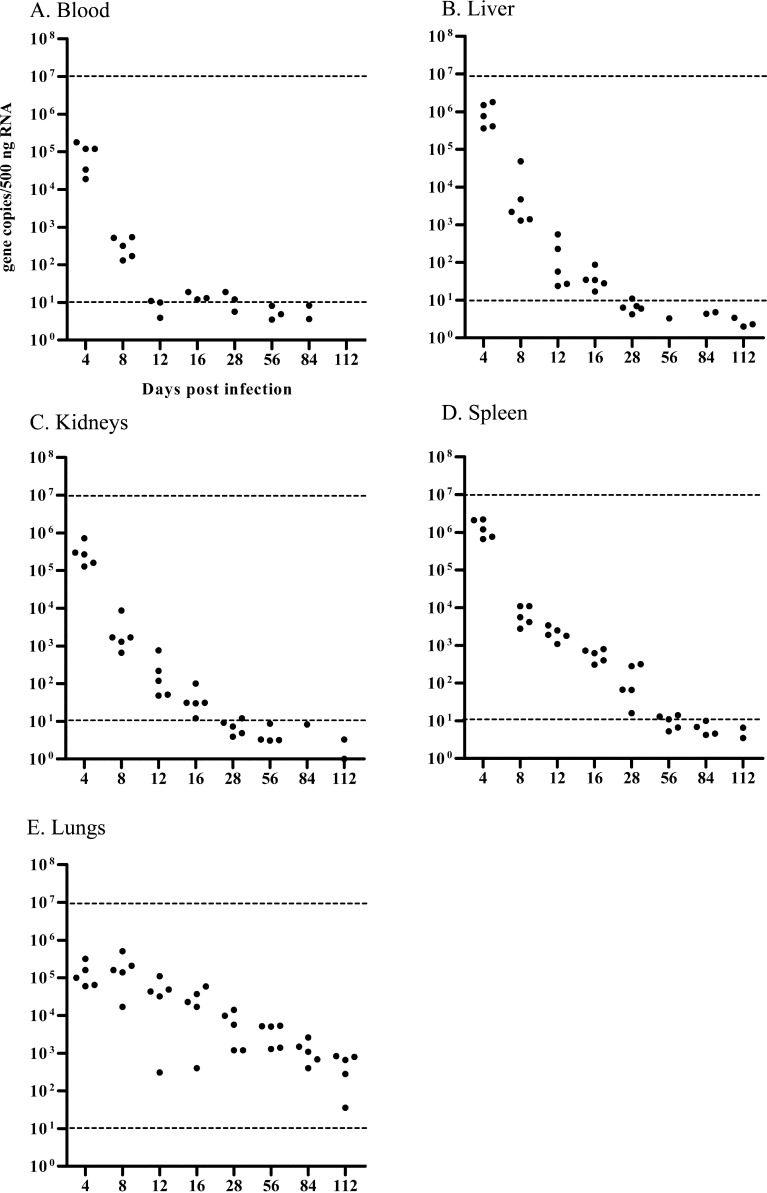
Fig. 3.
Viral genome load in tissues of C57BL/6 mice infected with 104 TCID50 of BRC at 4, 8, 12, 16, 28, 56, 84, and 112 dpi. Tissues were blood (A), lungs (B), liver (C), spleen (D) and kidneys (E). The viral genome copies/ 500 ng RNA of each mouse tissue was calculated with the Thermal Cycler Dice Real Time System Software based on the respective standard curves for each virus strain (circles). Dashed line indicates detection limits of synthesized RNA determined by standard curves. Viral genome load of several samples exceeded detection limits of synthesized RNA determined by standard curves, and non-quantifiable samples were not indicated.

