. 2017 Aug 7;6(1):A0060. doi: 10.5702/massspectrometry.A0060

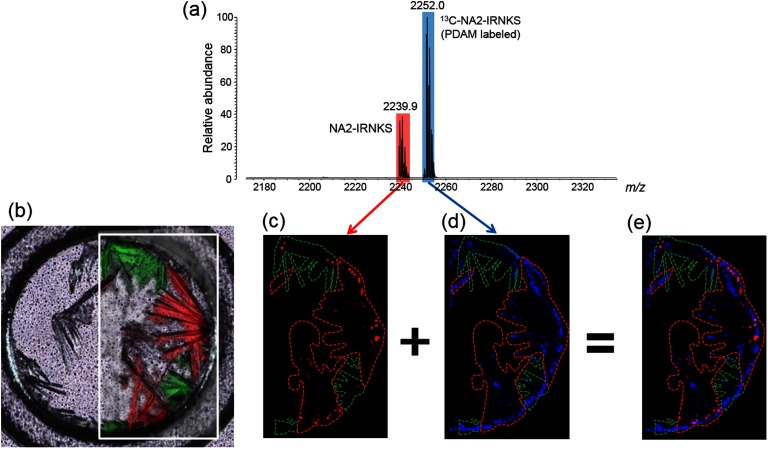
Fig. 6. (a) Mass spectrum of a sample containing a glycopeptide (NA2-IRNKS) and PDAM-derivatized 13C-NA2-IRNKS. (b) Confocal laser microscopy image and Raman microscopy image of the sample. Enclosed green area indicates the crystal with a Raman spectrum A and red area is the crystal with a Raman spectrum B. The same areas are shown in MS images of Figs. 6(c)–(e). The area surrounded with the green line corresponds to the crystal with Raman spectrum A. The area surrounded with the red line corresponds to the crystal with Raman spectrum B. (c) MS image of protonated NA2-IRNKS (m/z 2239.9). The black area indicates no signal and a red dot with stronger signal is shown more brightened. (d) MS image of protonated 13C-NA2-IRNKS (m/z 2252.0). The black area indicates the absence of a signal and a blue dot with stronger signal is shown more brightened. (e) The overlay images c and d. Reproduced from ref. 43.

Fig. 6. (a) Mass spectrum of a sample containing a glycopeptide (NA2-IRNKS) and PDAM-derivatized 13C-NA2-IRNKS. (b) Confocal laser microscopy image and Raman microscopy image of the sample. Enclosed green area indicates the crystal with a Raman spectrum A and red area is the crystal with a Raman spectrum B. The same areas are shown in MS images of Figs. 6(c)–(e). The area surrounded with the green line corresponds to the crystal with Raman spectrum A. The area surrounded with the red line corresponds to the crystal with Raman spectrum B. (c) MS image of protonated NA2-IRNKS (m/z 2239.9). The black area indicates no signal and a red dot with stronger signal is shown more brightened. (d) MS image of protonated 13C-NA2-IRNKS (m/z 2252.0). The black area indicates the absence of a signal and a blue dot with stronger signal is shown more brightened. (e) The overlay images c and d. Reproduced from ref. 43.