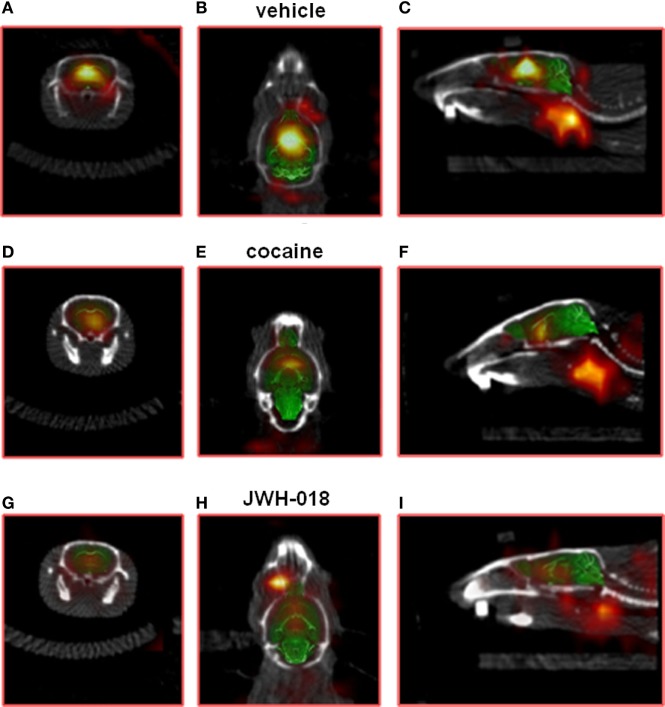
Figure 2.
Sample slice from a [123I]-FP-CIT SPECT/CT image of a vehicle [(A–C); respectively, coronal, transverse, and sagittal plan], cocaine [(D–F); respectively, coronal, transverse, and sagittal plan], and JWH-018 [(G–I); respectively, coronal, transverse, and sagittal plan] treated mice. ROIs for the striatum.

