Figure 1.
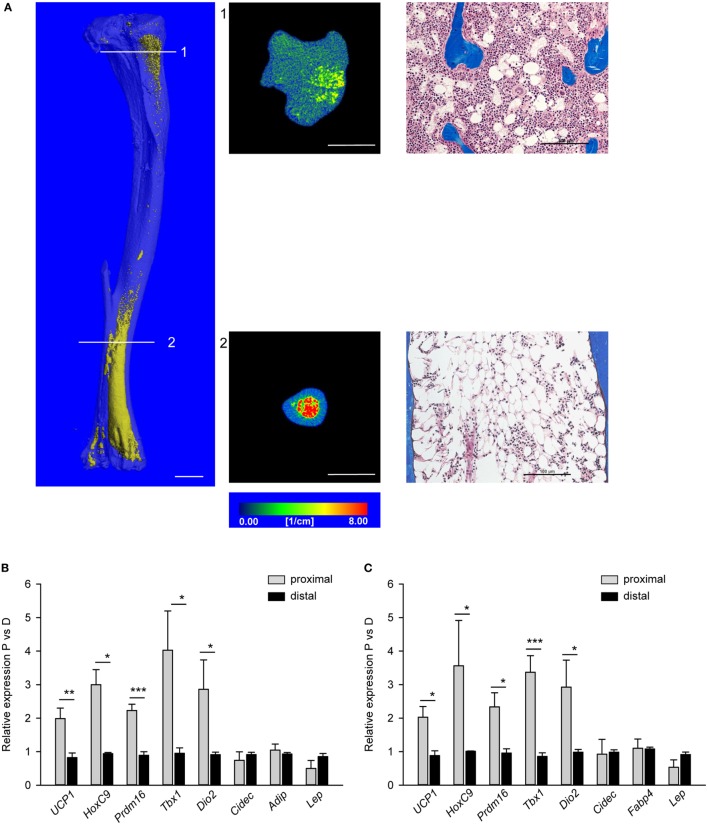
Morphology and polarity of tibia marrow adipose tissue (MAT). (A) (Left) Longitudinal microcomputed tomography (mCT) rendering of decalcified tibia bone stained with osmium tetroxide to visualize lipids (yellow). (Middle) Cross-sectional mCT renderings to visualize MAT distribution and density in proximal and distal tibia. Color scale indicates material density. The unit is a linear attenuation coefficient μ. Scale bars represent 1 mm. (Right) Representative longitudinal sections of proximal and distal non-decalcified tibia specimens stained with Masson’s Trichrome Stain (20× magnification). Scale bars represent 100 µm. (B) Gene expression profile of fat metabolic markers in proximal and distal tibia normalized to Fabp4 expression. (C) The same gene expression analysis as in (B) but were normalized to the levels of Adiponectin expression. Analysis was performed on four tibia bone isolated from four males (6 months old). *p < 0.05; **p < 0.01; ***p < 0.001.

