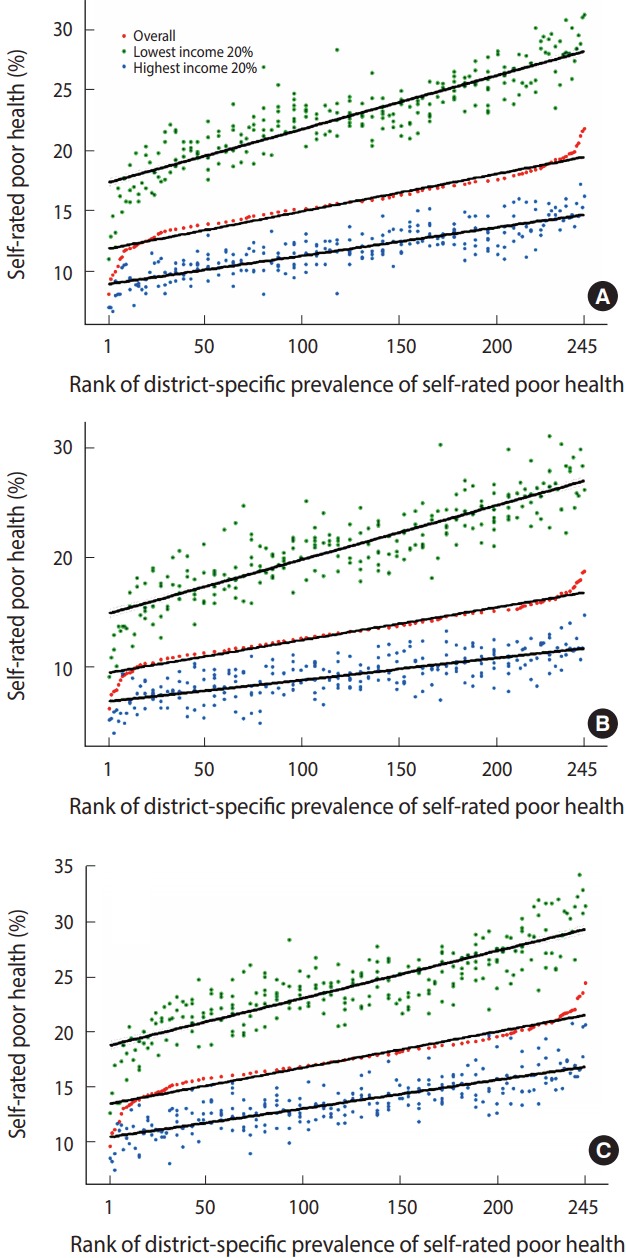
Figure 1.

Scatter plots and regression lines of age-standardized prevalence of self-rated poor health in overall, lowest income quintiles (Q5) and highest income quintiles (Q1) on the rank of district-specific prevalence of self-rated poor health in (A) total, (B) men, and (C) women, findings from the Korea Community Health Survey, 2008-2014.
