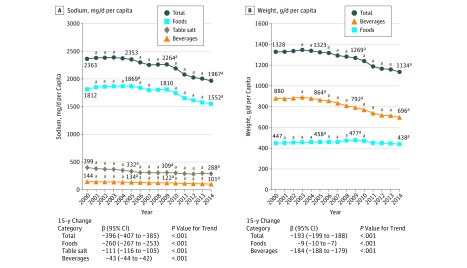
Figure 1. Sodium From US Households’ Packaged Food and Beverage Purchases and Trends in Total Purchases, 2000 to 2014.
Values are the adjusted mean sodium (mg/d) (A) or weight (g/d) (B) per capita from households’ packaged food and beverage purchases from retail food stores in a given year, determined from multivariable, longitudinal linear regression models regressing purchases on indicator variables for year; values for table salt were determined from a 2-part model, including (1) a longitudinal probit model of the probability of purchasing and (2) a longitudinal log-linear regression of the amount purchased among purchasers. P values for time trends were derived from multivariable regression models treating year as a continuous variable, including linear, quadratic, and cubic terms as appropriate. All models were adjusted for household size and composition, race/ethnicity, income, educational level, and geographic market, and means were predicted at the distribution of race/ethnicity by income from US Census Bureau data. Data are from the Nielsen Homescan Consumer Panel, including 172 042 US households (754 608 year-level observations).
aSignificantly different from 2000 (P < .001 by Wald postestimation test).

