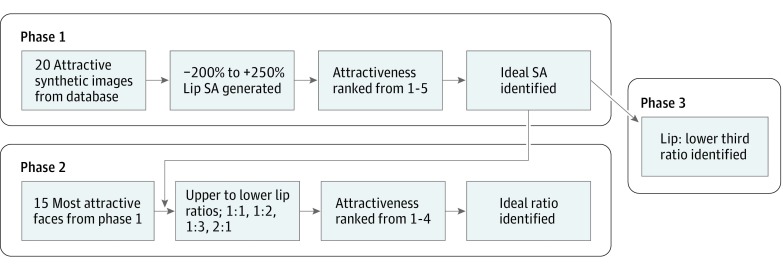
Figure 1. Diagram of the Study Design.
From the synthetic images database, 20 attractive faces are initially selected. In phase 1, the range of lip surface area (SA) was generated and ranked by focus groups to determine the ideal SA. This SA is then used for phase 2, where upper to lower lip ratios are varied to determine the ideal by cardinal ranking. In phase 3, the same ideal SA was used to determine the percentage of the lip SA to the lower facial third.

