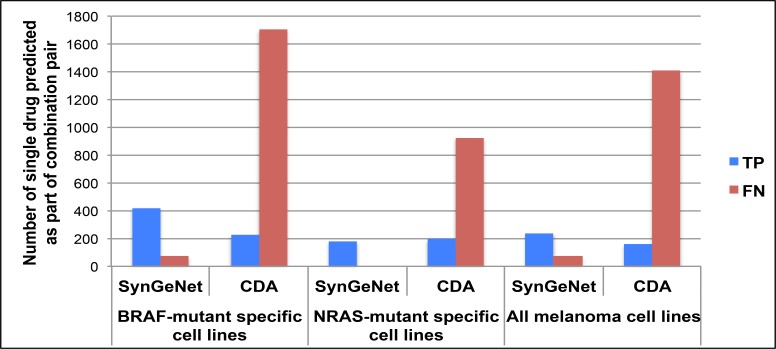
Figure 5:
Comparison of SynGeNet and CDA methods in predicting drugs validated as part of combination regimens observed to be most effective in several cell line groups: BRAF-mutant specific cell lines, NRAS-mutant specific cell lines and all melanoma cell lines. The number of true positives and false negatives are shown for each method in each melanoma cell line group. For CDA, TP vs. FN status was classified by negative and positive enrichment scores (p<0.05), respectively. For SynGeNet, TP vs. FN status was determined by whether the drug was included in the final drug combination prediction list.

