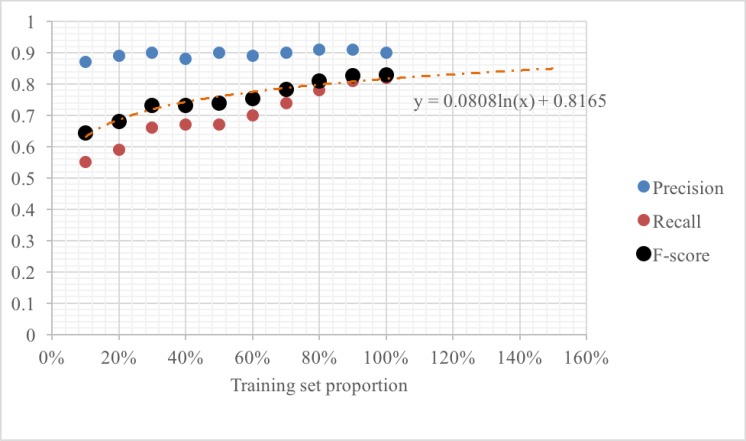
Figure 2:
Precision, Recall and F-scores for our system over a blind evaluation set for various training set sizes (100% = 48 documents). The figure shows that precision remains fairly constant for our system, but recall shows steady improvement as more training data is utilized. We fit a logarithmic trend line to the F-score curve to derive the relationship between training set size and classification performance.

