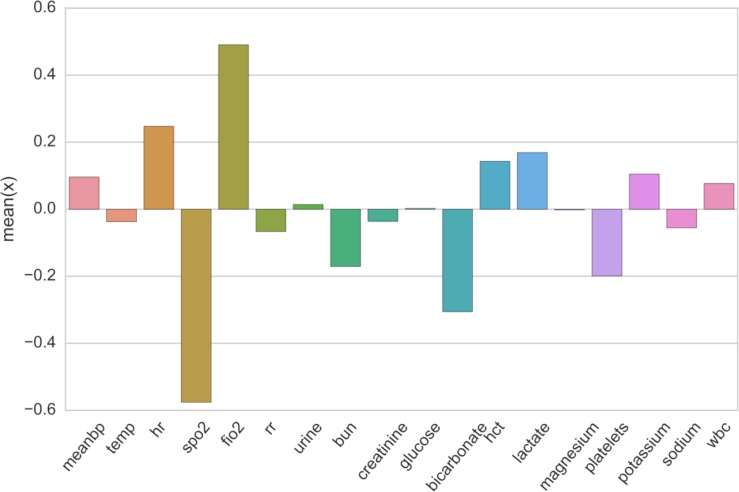
Figure 4:
Average value of dynamic features xnt assigned to timesteps strongly associated with state index 9. Values are z-score standardized per variable. State 9 had very low observed spo2 and bicarbonate levels as compared to other states. Lactate levels were the highest observed across all states - no other state had significant positive lactate z-scores.

