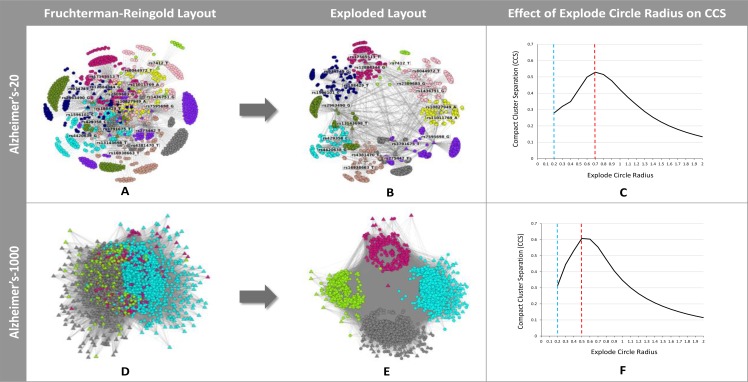
Figure 8.
Network layouts before and after application of the ExplodeLayout algorithm for the Alzheimer’s-20 and Alzheimer’s-1000 networks, and the respective CCS scores (the dashed blue line shows the explode circle radius for the corresponding FR layout, and the dashed red line shows the explode circle radius corresponding to the maximum CCS score).

