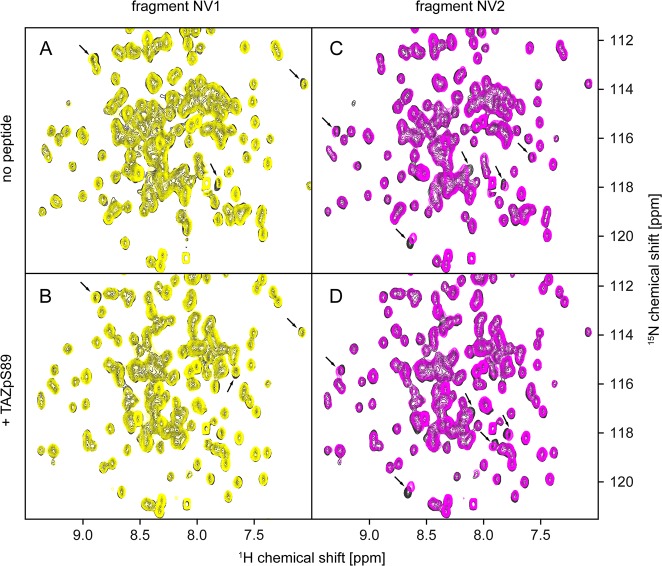
Figure 2.
Chemical shift perturbations induced by binding of fragments NV1 (left) and NV2 (right) to 14-3-3 in the apo form (top) and complexed with the TAZpS89 peptide (bottom). The reference 1H–15N HSQC spectrum of the 14-3-3/TAZpS89 complex is colored gray, that of the 14-3-3/TAZpS89/NV1 complex yellow, and that of the 14-3-3/TAZpS89/NV2 complex magenta. In addition to 100 μM 14-3-3, the samples contained (A) 1 mM NV1, (B) 150 μM TAZ and 1 mM NV1, (C) 1 mM NV2, and (D) 150 μM TAZ and 1 mM NV2. 2D 1H–15N HSQC spectra were recorded as described in Materials and Methods.

