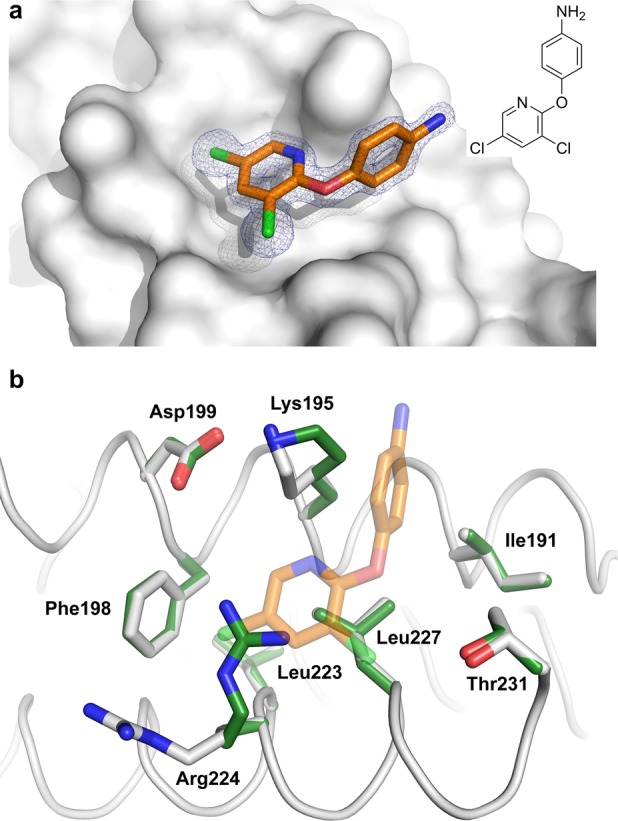
Figure 4.

Crystal structure of fragment NV3 binding to 14-3-3. (a) NV3 (orange sticks) binding to 14-3-3σ (gray surface). The final 2Fo – Fc electron density map (contoured at 1.0σ) is shown as blue mesh. (b) Structural comparison of the 14-3-3 residues in the NV3 binding pocket in the presence (white sticks) and absence (green sticks) of NV3.
