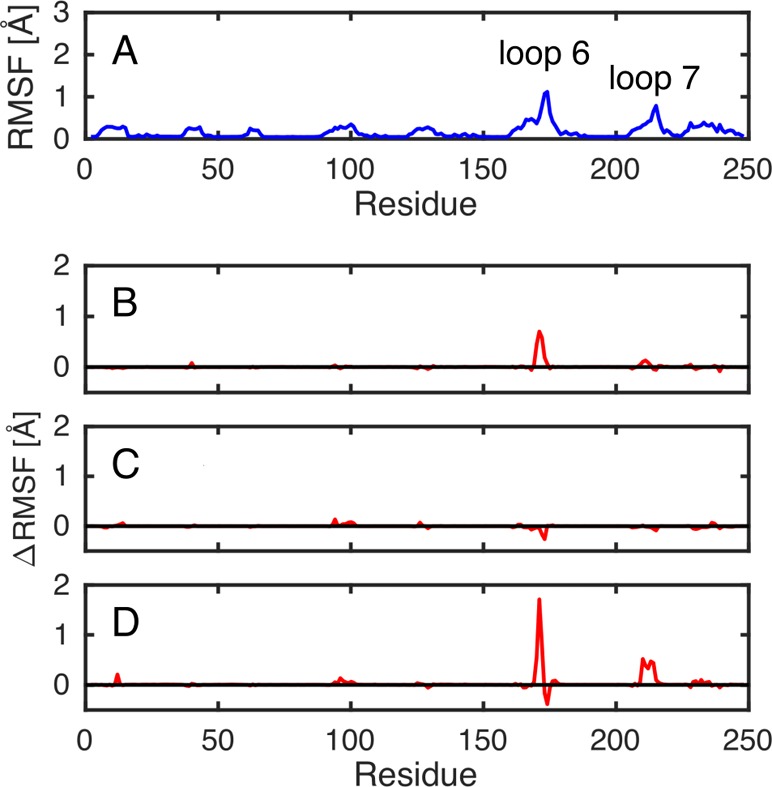
Figure 6.

Root-mean-square fluctuations (RMSF) of the backbone α-amino acid carbons at the transition state complexes for the TIM-catalyzed deprotonation of DHAP determined for a single enzyme subunit. (A) The total fluctuations observed for the wild-type enzyme. (B–D) The difference between the fluctuations of wild-type TIM and the specified enzyme variant (where (B), (C), and (D) denote the I170A, L230A, and I170A/L230A variants, respectively). Data were collected every 5 ps from three individual 40 ns molecular dynamics trajectories for each system, and represent a total of 90 ns simulation time per system (the first 10 ns of each trajectory was discarded as equilibration; see the description in the main text). The corresponding plots of data for TIM-catalyzed deprotonation of GAP at the transition state are given in Figure S4.
