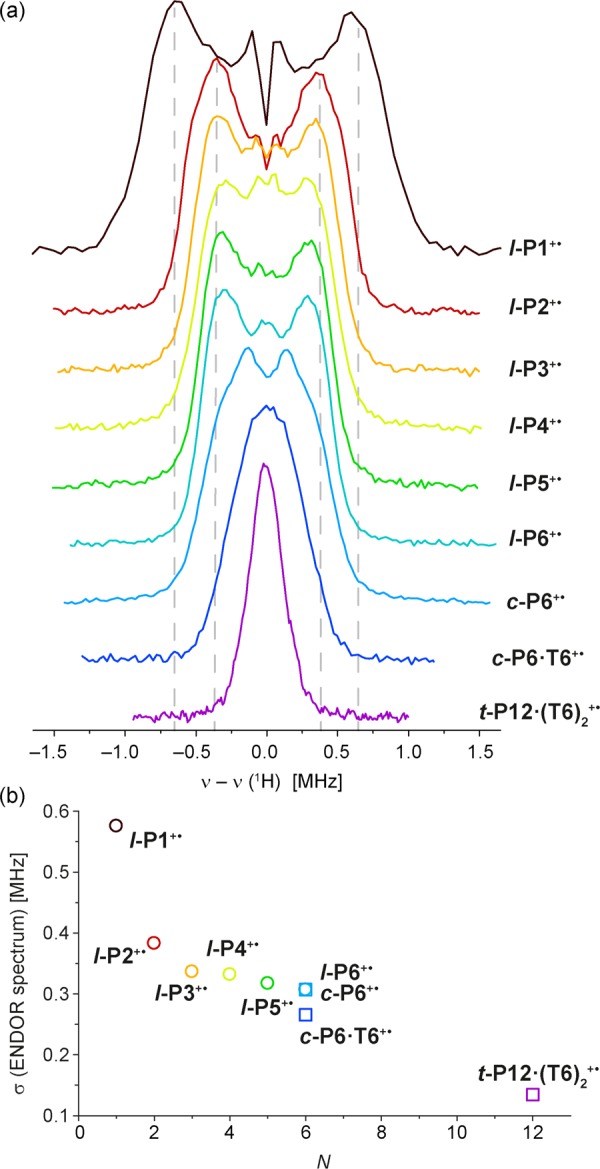
Figure 10.

(a) W-band 1H Mims ENDOR spectra of the radical cations of l-P1 to l-P6, c-P6, c-P6·T6 and t-P12·(T6)2 in toluene-d8:THF-d8:CD2Cl2 1:1:1, generated by oxidation with thianthrenium hexachloroantimonate, recorded at 80 K at the field position of the signal maximum. (b) Standard deviations (σ) of the ENDOR spectra, versus the number of porphyrin units (N).
