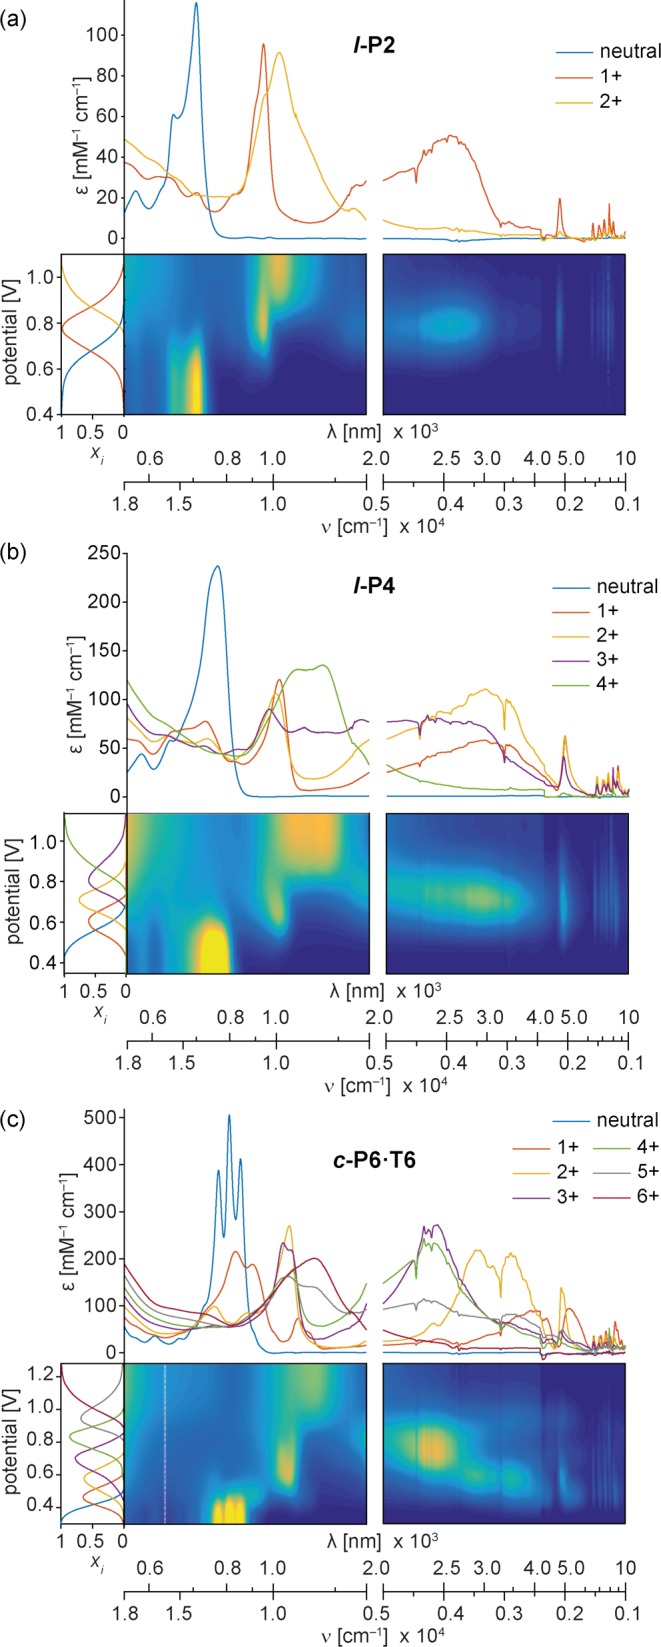
Figure 3.

Deconvoluted spectroelectrochemical data for oxidation of (a) l-P2, (b) l-P4 and (c) c-P6·T6 in CH2Cl2/Bu4NPF6. The contour plots show normalized absorbance (color axis) as a function of electrochemical potential. The resolved spectra for individual oxidation states are shown above each contour plot, with the corresponding speciation curves in the left subplots.
