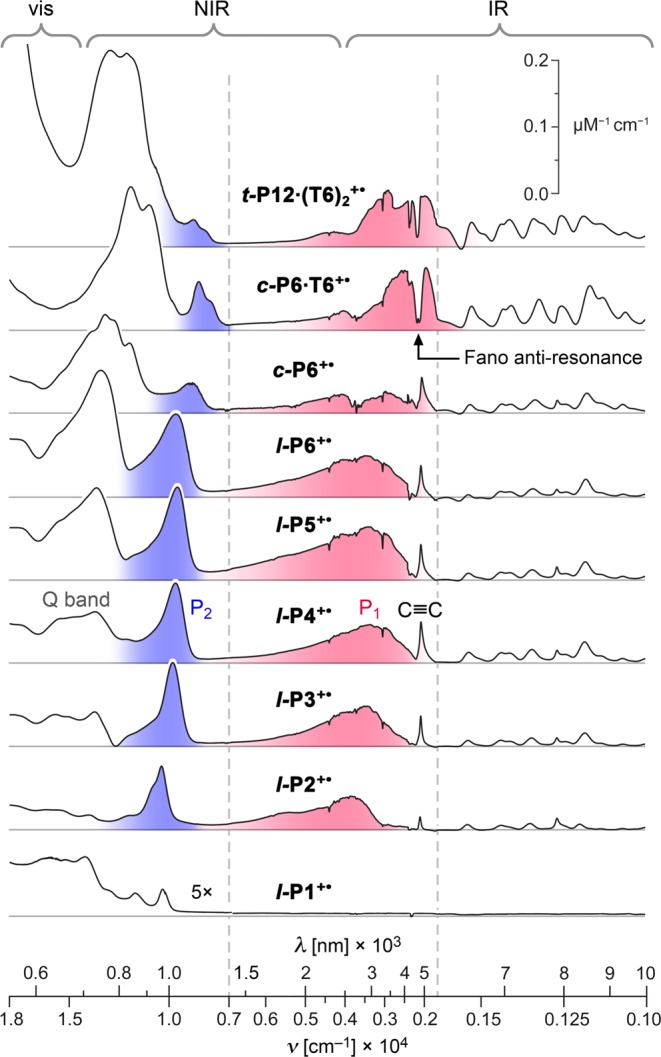
Figure 4.

Visible–NIR–IR absorption spectra of 1+ oxidation states (P1 band red and the P2 band blue) from spectroelectrochemistry in CH2Cl2/Bu4NPF6. The vertical dashed lines indicate regions with different energy scales. The intensity of the monomer spectrum (l-P1+•) is multiplied by a factor of 5 to aid visual comparison.
