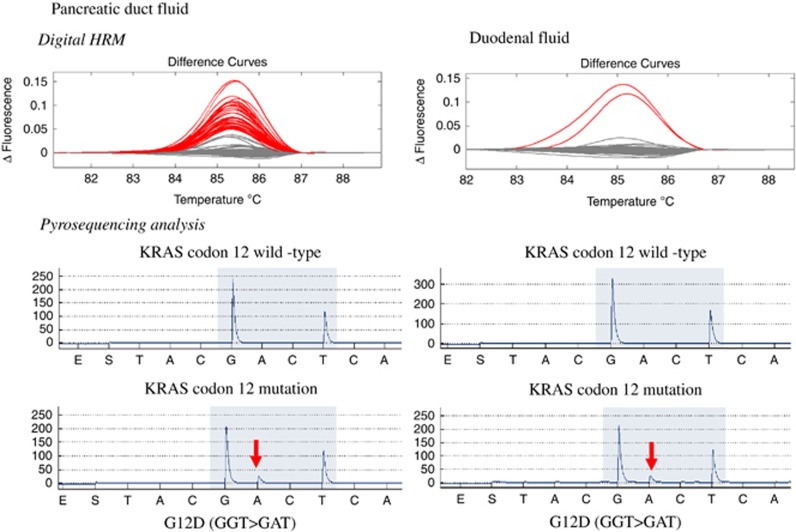
Figure 1.
Representative examples of melt-curve analysis and pyrosequencing of pancreatic duct fluid (left) and duodenal fluid (right). The curves in a represent the melt curves generated from one 96-well plate of PCR products amplified from pancreatic duct juice DNA. b is the same, except that they are generated from duodenal fluid DNA. The gray curves are wild-type; these same curves are generated from melting PCR products amplified from wild-type DNA. The red curves are scored as mutant because similar curves are generated when melting PCR products amplified from DNA samples with KRAS codon 12 mutations. There are many more red curves in a than b because there were more KRAS-mutant DNA molecules in the duct juice sample compared with the duodenal fluid sample. c and d are representative pyrosequencing results from PCR wells with normal melt curves (i.e., wild-type for KRAS). e and f are pyrosequencing results from PCR wells that had mutant melt curves.

