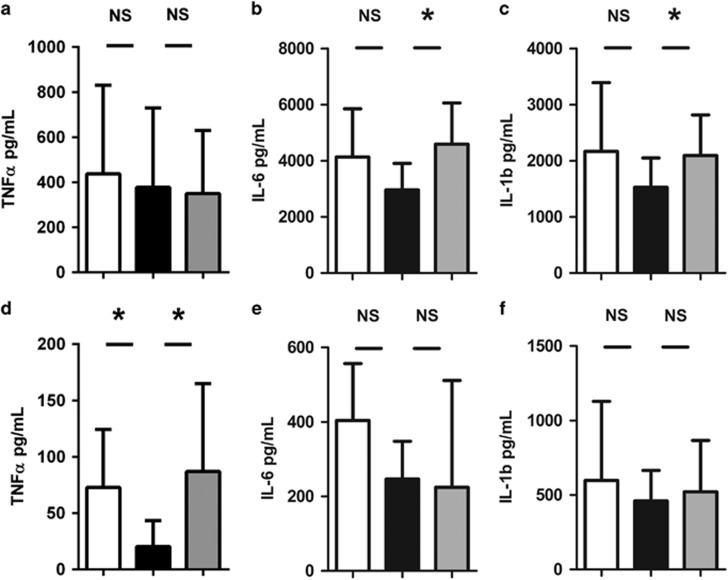
Figure 2.
(a–c) Tumor necrosis factor (TNF)-α, interleukin (IL)-6, and IL-1β levels in supernatant after stimulation of whole blood with lipopolysaccharide (LPS) 10 ng/ml for 24 h; (d–f) TNF-α, IL-6, and IL-1β levels in supernatant after stimulation of isolated peripheral blood mononuclear cells with 100 ng/ml LPS for 4 h. White bars represent day 0, black bars day 8, and gray bars week 7. Results are represented as mean±s.d. (a–d) or median±interquartile range (e and f); P-values are calculated between groups as indicated by lines. *P<0.05, NS, not statistically significant.

