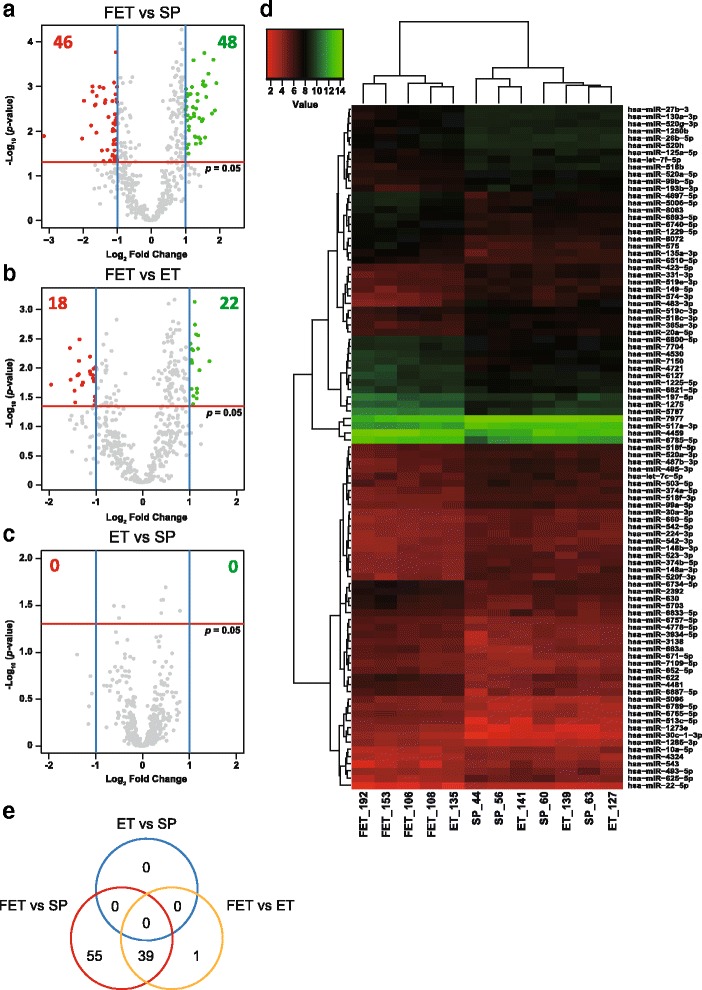
Fig. 1.

Expression profiles of miRNAs. The volcano plots show miRNA microarrays comparing FET and SP placentae a, FET and ET placentae b and ET and SP placentae c. Plots were constructed using the fold change and p values, enabling visualization of the relationship between the fold change and statistical significance. The y-axis is the negative log10 of p values (a higher value indicates greater significance) and the x-axis is the difference in expression between two experimental groups as measured in log2 scale. The vertical blue lines correspond to 2-fold up and down, respectively, and the horizontal red line represents a p value of 0.05. The green and red points in the plot represent the differentially expressed miRNAs with statistical significance. d A heat-map showing differential miRNA expression profiles among the three experimental groups. Red represents downregulated miRNAs and green represents upregulated miRNAs. e A Venn diagram showing the number of differentially expressed miRNAs among the three comparisons
