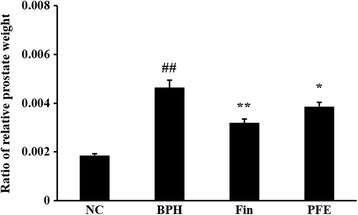
Fig. 3.

Effect of PFE on prostate weight in rats with TP-induced BPH. Ratio of relative prostate weight is the ratio of prostate weight to body weight (g/g). NC (normal control group), corn oil injection (s.c.) + PBS administration (p.o.); BPH (control group), TP (3 mg/kg)/corn oil injection (s.c.) + PBS administration (p.o.); Fin (positive control group), TP (3 mg/kg)/corn oil injection (s.c.) + finasteride administration (10 mg/kg, p.o.); PFE (PFE-treated group), TP (3 mg/kg)/corn oil injection (s.c.) + PFE administration (200 mg/kg, p.o.). Data are presented as mean ± S.E.M. (n = 6). Significant differences at ## P < 0.01 compared with the NC group. Significant differences at * P < 0.05 and ** P < 0.01 compared with the BPH group. BPH, benign prostatic hyperplasia; Fin, finasteride; PBS, phosphate-buffered saline; PFE, Ponciri fructus extract; p.o., peroral; s.c., subcutaneously; TP, testosterone propionate
