Figure 5.

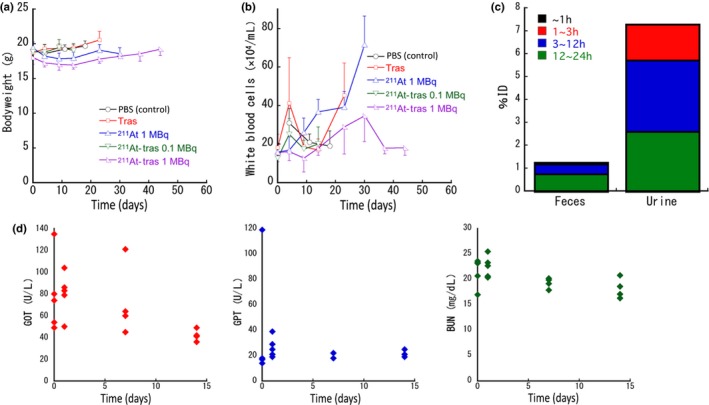
Side‐effects and excretion of astatine‐211 (211At) in a mouse model of peritoneal metastasis of gastric cancer treated with 211At‐labeled trastuzumab (211At‐tras). (a) Bodyweight of the mice after treatment. Plots were interrupted if the animal reached the defined endpoint. Data represent mean ± SD. (b) White blood cell counts in the mice after treatment. Plots were interrupted if the animal reached the defined endpoint. Data represent mean ± SD . (c) 211At levels in feces and urine of the mice up to 24 h after i.p. injection of 211At‐tras (1 MBq). Six mice were used in the experiment. The bars represent the cumulative mean values obtained over a 24‐h observation period. Bars are labeled in the graph. (d) Glutamic oxaloacetic transaminase (GOT; red), glutamic pyruvate transaminase (GPT; blue), and blood urea nitrogen (BUN; green) values up to 14 days after i.p. injection of 211At‐tras (1 MBq). Five mice were used for 0 and 1 days, and four mice were used for 7 and 14 days. Data for each mouse are shown in the graph.
